OK, this is a rant.
 It annoys me to no end when people present graphs like this one. Yes, the numbers do in fact add up to 100% but does it make any sense to have so many digits after the decimal when in reality this is based on a sample size of 6? Wouldn’t 1/2, 1/3, 1/6 have sufficed? What about 0.5, 0.33 and 0.67. Do you really really have to go to all those decimal places?
Excel has made it easy for people to make meaningless graphs like this, where merely clicking a little button gives you more decimal places. I’m firmly convinced that just having more digits after the decimal point doesn’t really make a difference in a lot of situations.
Let’s start first with some definitions
accuracy is a “degree of conformity of a measure to a standard or a true value“.
precision is the “the degree of refinement with which an operation is performed or a measurement stated“.
One can be precise, and accurate. For example, when I say that the sun rises in the east 100% every single day, I am both precise, and accurate. (I am just as precise and accurate if I said that the sun rises in the east 100.000% of the time).
One can be precise, and inaccurate. For example, when I say that the sun rises in the east 90.00% of the time, I am being precise but inaccurate.
So, as you can see, it is important to be accurate; the question now is how precise does one have to be. Assume that I conduct an experiment and tabulate the results, I find that 1/2 the time I have outcome A, 1/3 of the time I have outcome B, and 1/3 of the time I have outcome C. It would be both precise, and accurate to state the results are (as shown in the pie chart above) 50.0000%, 16.66667%, and 33.33333% for the various possible outcomes.
But does that really matter? I believe that it does. Consider the following two pictures, these are real pictures, of real street signs.
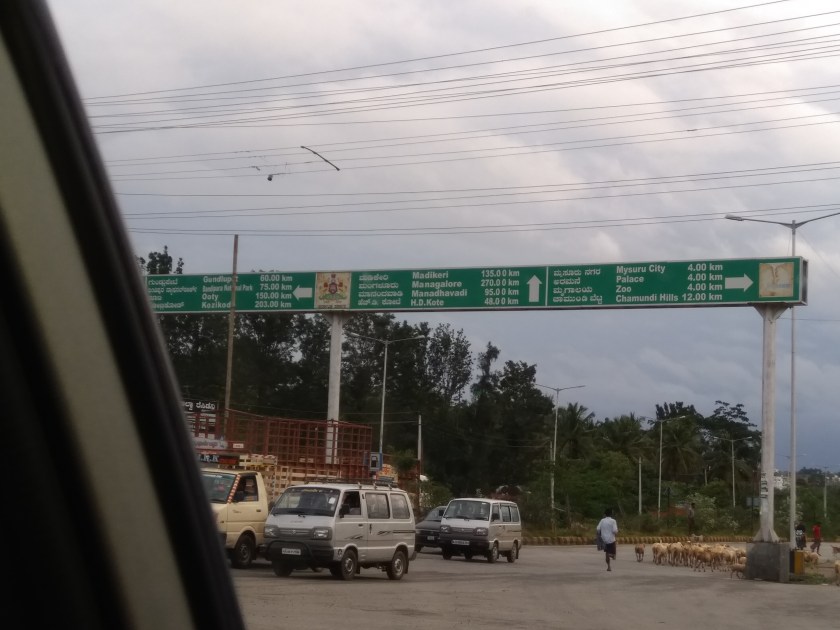
This sign is on the outskirts of Mysore, in India.
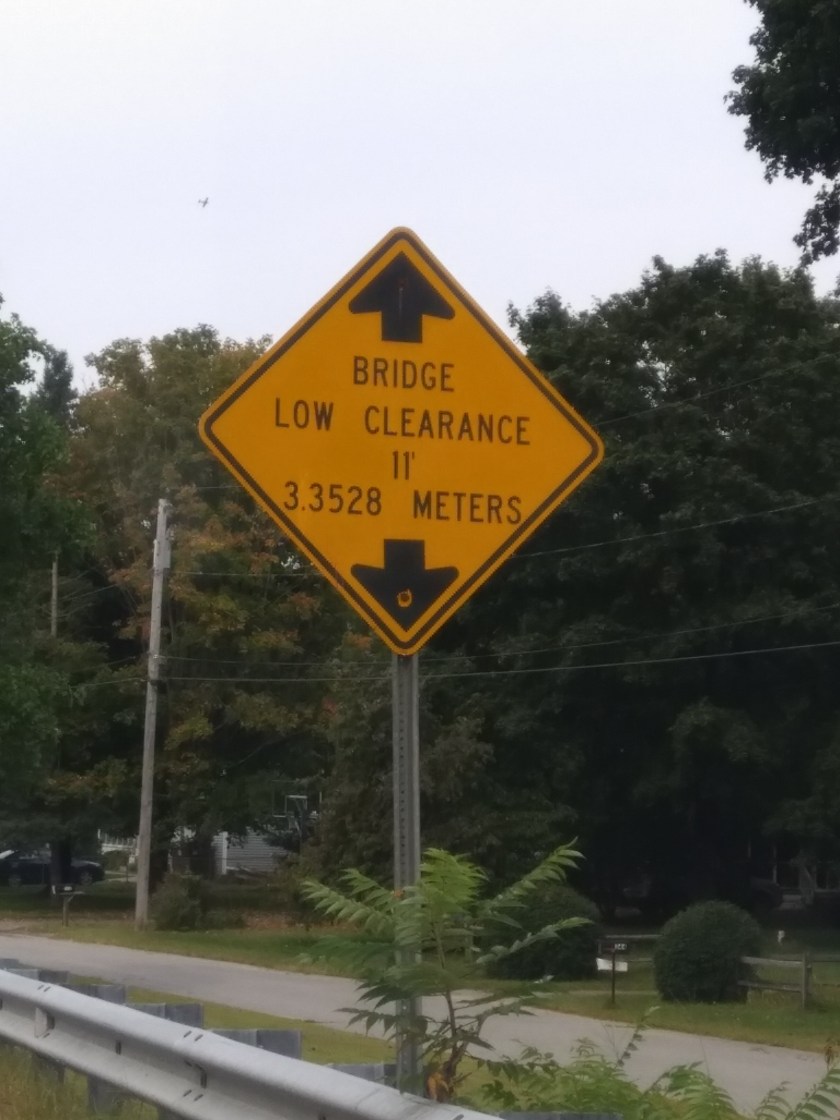
This sign is in Lancaster, MA.
In the first picture (the one from Mysore, India), we have distances to various places, accurate to 0.01km (apparently). Mysore Palace is 4.00 km away, the zoo is 4.00 km away, Mangalore is 270.00 km away. What’s 0.01km? That’s about 10m (about 33 feet). It is conceivable that this is accurate (possible, not probably). So I’d say this is precise and may be accurate.
The second picture (the one from Lancaster, MA) is most definitely precise, to 4 places of the decimal point no less. The bridge is 3.3528 meters (the sign claims). It also indicates that it is 11 feet. A foot is 12 inches, an inch is 2.54 centimeters, and therefore a meter (100cm is 39.3701″) is exactly 3.2808 feet. Therefore 11 feet is 3.3528 meters exactly. So this is both precise, and accurate (assuming that the bridge does in fact have a 11′ clearance).
The question is this, is the precision (4.00km, or 3.3528m) really relevant? We’re talking about street signs, measuring things with a fair amount of error. In the case of the bridge, the clearance could change by as much as 2″ between summer and winter because of expansion and contraction of the road surface (frost heaves). So wouldn’t it make more sense to just stick with 11′, or 3.5 meters?
So back to our graph with the 50.0000%, 16.66667% and 33.33333%. Does it really matter to the person looking at the graph that these numbers are presented to a precision of 0.000001%? For the most part, given the fact that the experiment had a sample size of 6, absolutely not.
So please, when presenting facts (and numbers) please do think about accuracy; that’s important. But please make the precision consistent with the relevance. When driving a car to the zoo, is the last 33′ going to really kill me? or am I really interested in the clearance of the bridge accurate to the thickness of a human hair, or a sheet of paper?
